Green-screen Chart/Graph
From MidrangeWiki
=Green-screen Chart/Graph
Background
It is sometimes useful to display a graph of values on the AS400 green-screen. Although there are commercial products available for the AS400, these are often difficult to use and not available everywhere. This product was designed to allow for a simple text-based line-graph to be displayed on the screen. It will take a data-structure from another program, and build up the screen accordingly.
The program has been written to work correctly on either a wide screen (27x132) or a normal screen(24x80).
Screen Layout
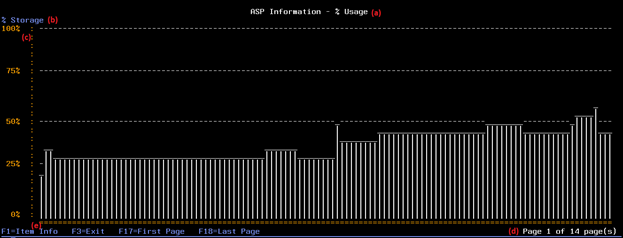
- a. This is the header as passed to the program
- b. This is the Y-label, as passed to the program
- c. The Y-axis values will be build based on the chart type or the chart calc function
- d. If the number of data points exceed the screen width, the program will create additional pages. Page Up/Down will show the rest of the entries. If you want to jump to the 1st page, press F17, or last page press F18.
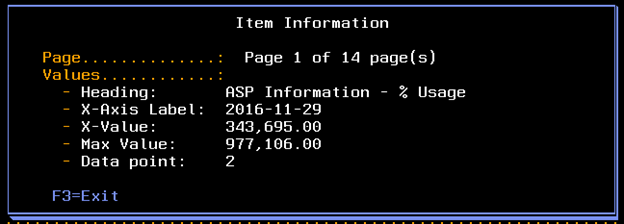
- e. If you position your cursor on any data item/column, and press F1, the program will display information about the data point
Objects
The following objects will be used by the program:
- a. GENCHART#D - Display File
- b. GENCHART#R – RPG Program
GenChart Program Parameters
The GENCHART#R program requires the following parameters:
- a. Data structure (see point 4):
- - The data structure will be passed from your program, to the GENCHART#R program, by using pointers. When you call the program, the variable has to use %ADDR(DSNAME).
- b. Heading:
- - Char (100).
- - The heading you need for your chart
- c. Y-Axis Label:
- - Char(30)
- - Here you can specify a label for the Y-Axis.
- - Label will be affected by the Chart Type variable
- d. Total Items:
- - Int(10)
- - Specify the number of values to be passed via the DataStructure
- e. Max Value:
- - Packed(31:2)
- - Specify the Maximum value. This is needed to determine the sizing of the bars
- f. Chart Type
- - Char(10)
- - Allows for two types of charts. Can be either
- *PCT: Determine %, betwee max value and actual value
- *NORMAL: Display the values on the screen as they are
- g. Chart Calc:
- - Char(10)
- - If the values are too big, the program can scale them. Allowed values are:
- *NONE – Keep the values as is
- *TB – Scale the values in Terrabytes
- *GB – Scale the values in Gigabytes
- *KB – Scale the values in Megabytes
- *KB – Scale the values in Kilobytes
RPG Program Usage
In order to use the GENCHART functionality inside your RPG program, the following is needed:
- a. Data structure: A datastructure has to be passed onto the calling program. This data structure HAS to use the following definitions:
- - The DataStructure must be limited to 9999 entries.
- - Field 1 is a description field, 30 chars long. It will be used for the X-Axis
- - Field 2 is a numeric field, packed 31:2.
    *====================================================================*
      dcl-ds TestDS                       qualified dim(9999);
          wDescription                    char(30);
          wDataItem                       packed(31:2);
      end-ds;
    *====================================================================*
- b. GenChart Prototype: Add the prototype for the external program:
    *====================================================================*
      dcl-pr GenChart                     extpgm('GENCHART#R');
          p_InputDS                       pointer const;
          p_Heading                       char(100) const;
          p_Ylabel                        char(30) const;
          p_TotalItems                    like(TInt) const;
          p_MaxValue                      packed(31:2) const;
          p_ChartType                     char(10) const;
          p_YCalc                         char(10) const;
      End-pr;
    *====================================================================*
- c. Clear the data structure: You have to clear the data structure before you use it, to ensure it does not contain null values.
    *====================================================================*
      clear TestDS;
    *====================================================================*
- d. Build up your SQL String:
- - Limit your data to 9999 entries, either in the SQL String or in the fetch statement
- - Use casting in SQL to ensure the data match the data structure
    *====================================================================*
      SQLString =
          'SELECT cast( ADATE as char(30)) as "WorkDate", cast(aspsizusd as '+
          'decimal(31,2)) as "Value" FROM aspinf#p order by aDate';
    *====================================================================*
- e. Prepare the SQL cursor now:
- - Use SQL diagnostics to determine the number of records returned
    *====================================================================*
        exec sql Prepare SQLGET1 from :SqlString;
        exec sql declare IntCursor1 insensitive cursor for SQLGet1;
        exec sql Open IntCursor1;
        exec sql get diagnostics :wRecCount = DB2_NUMBER_ROWS;
    *====================================================================*
- f. Fetch the data:
    *====================================================================*
           exec sql fetch IntCursor1  for 9999 rows into :TestDs;
           // Cose the Cursor
           exec sql close Intcursor1;
    *====================================================================*
- g. Determine the maximum size for the range:
    *====================================================================*
           exec sql select max(aspsiztot) into :wMaxValue from ASPINF#P;
    *====================================================================*
- h. Generate the chart now:
    *====================================================================*
           GenChart(%addr(TestDs):'ASP Information - % Usage':'% Storage':
               wRecCount:wMaxValue:'*PCT':'*NONE');
           GenChart(%addr(TestDs):'ASP Information':'Size in GB':wRecCount:
              wMaxValue:'*NORMAL':'*NONE');

