Remote Debug of Java using RDi
Debugging using SEP's in RDi is a huge productivity booster for developers, but it only supports ILE languages. Notably missing from that is Java. While RPG can call Java methods, the ILE debugger is unable to follow the program flow into the Java code. This page discusses just how to make that happen using RDi and the remote Java debug capability built into Eclipse. This appeared in Eclipse 3.4 (Ganymede), so should be available at least back to RDi 8.0? I am working in RDi 9.5, so these instructions are specific to that release. I found a blog on developerworks that helped immensely [1].
Contents
[hide]Steps
- Start a remote debug session in Eclipse
- Start up your JVM in remote debug mode
- Set up you SEP
- Call the RPG program you wish to debug
Setup
There is some initial setup required for this to work. You need to have a remote debug session configured in Eclipse, and a way to start your JVM in remote debug mode on IBM i. Here is what I did:
Eclipse - Create a Remote Debug Configuration
Open your RDi workspace and make sure you are in the RSE perspective (the menus are shorter)
1. Navigate the menu to Run->Debug Configurations...
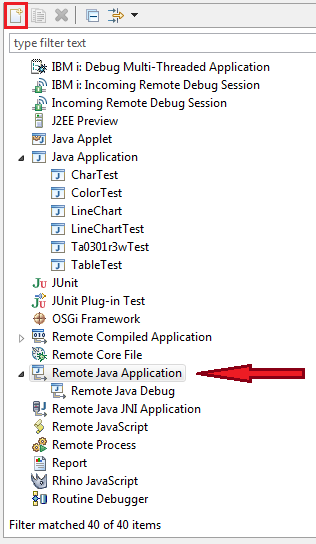
2. Select Remote Java Application, and create a new configuration there
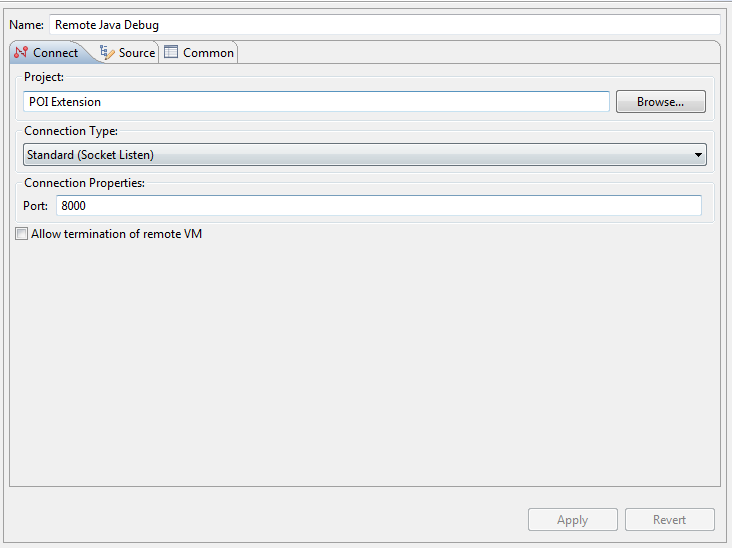
3. In the right hand side of the dialog, name your remote debug session, and tell it which project contains the jars you will be debugging. I have some extension that I have developed to help with calling into Apache POI, and that project has in it's classpath everything I need to debug, so that is the Project I selected.
4. Select a Connection Type. This should be Standard (Socket Listen).
5. And make sure Allow termination of remote VM is not checked. This is a deviation from the Developerworks blog, but I don't want to be terminating the JVM on IBM i. That would require me to log off then back on to IBM i for each debug session. You only get one JVM per job on IBM i, and once it is terminated, the only way to get a new one is to start a new job (log back in).
6. Click Apply, then Close
IBM i - CL Program
The easiest way to make sure you have a reliably started JVM is to create a CL program to do it. I have two, one for debugging, and one for non debugging. The only difference is the -Xdebug and -Xrunjdwp options. Here is my debug CL
            PGM
            DCLPRCOPT  DFTACTGRP(*NO) ACTGRP(*NEW) BNDDIR(JCS) +
                       USRPRF(*OWNER)
            DCL        VAR(&POINTER) TYPE(*PTR)

              ADDENVVAR  ENVVAR(CLASSPATH) +
                           VALUE('+
                             /java/poi-3.14/poi-3.14-20160307.jar:+
                             /java/poi-3.14/poi-ooxml-3.14-mx-dev.jar:+
                             /java/poi-3.14/poi-ooxml-schemas-3.14-20160307.jar:+
                             /java/poi-3.14/lib/commons-codec-1.10.jar:+
                             /java/poi-3.14/lib/commons-logging-1.2.jar:+
                             /java/poi-3.14/lib/log4j-1.2.17.jar:+
                             /java/poi-3.14/ooxml-lib/xmlbeans-2.6.0.jar:+
                             /java/poix/poi-extend-dev.jar:+
                             /java/metalex/reports-dev.jar:+
                             /java/javamail/javax.mail.jar:+
                             /java/rpgmail/rpgmail.jar:+
                           ') LEVEL(*JOB) REPLACE(*YES)
            ADDENVVAR  ENVVAR(QIBM_RPG_JAVA_PROPERTIES) +
                         VALUE('+
                           -Djava.awt.headless=true;+
                           -Dos400.stderr=file:/home/murphymdev/stderr.txt;+
                           -Xdebug;+
                           -Xrunjdwp:transport=dt_socket,+
                                     address=127.0.0.1:8000,+
                                     suspend=y;+
                         ') REPLACE(*YES)

            ADDENVVAR  ENVVAR(QIBM_USE_DESCRIPTOR_STDIO) VALUE('Y')
            ADDENVVAR  ENVVAR(JAVA_HOME) +
                         VALUE('/QOpenSys/QIBM/ProdData/JavaVM/jdk626/32bit'+
                         ) REPLACE(*YES)
            ADDENVVAR  ENVVAR(QIBM_RPG_JAVA_EXCP_TRACE) VALUE('Y')

            CALLPRC    PRC(START_JVM) RTNVAL(&POINTER)
OUT:        ENDPGM
Look in environment variable QIBM_RPG_JAVA_PROPERTIES, the properties -Xdebug;-Xrunjdwp:transport=dt_socket,address=127.0.0.1,suspend=y; is the secret sauce to have your JVM connect to the debugger in RDi. You must of course change the IP in address to the IP address of your PC so that the JVM can find it.
One note here, the procedure START_JVM is a procedure from Scott Klement's HSSF service program which you can get from his website [2]. You have to make a modification to export the procedure, but otherwise it is in there.
Engage
Now you are ready to go:
- Go back and select the remote debug configuration you created earlier and click Debug. You should see a Waiting for connection message to appear in the bottom right hand corner of your RDi window.
- Call your JVM Startup CLP from your green screen command line. You should see the Waiting for connection message go away.
- Now go set up your SEP and call the RPG you wish to debug. You can step directly into the Java methods from your RPG code.
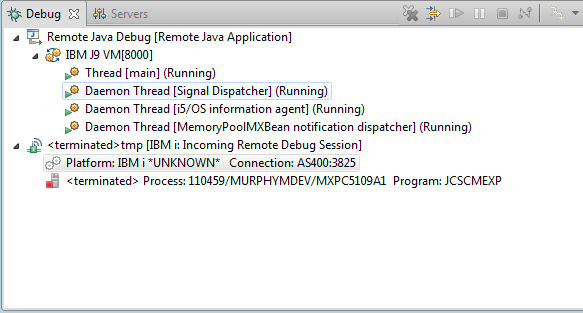
In the RDi Debug View, you will see both the IBM J9 VM and the IBM i: Incoming Remote Debug Session. The RPG procedures and stack will be visible in the IBM i: Incoming Remote Debug Session. The Java stack with be in the J9 section. You can click on any procedure to go straight to the source. Debug as you would with SEP's
Notes
- If you log off your green screen session while the Remote Java Debugger is still connected, you have to disconnect the Java debugger before running your JVM setup CL again. Something about loosing connection prevents the debugger from going back into a listen state, and the JVM on the IBM i side will hang.
- If you start remote JVM before you start the Remote Java Debugger, you will have to wait for a bit, and the JVM on IBM i will appear to hang, but it should pick up. It connected before I finished writing this note.
- If you disconnect the Java Debugger, you can re-launch it, but it will not reconnect until you log off your IBM i session, log back on, and restart the JVM.
- If you do not have the Remote Java Debugger listening for a connection, the JVM will hang on IBM i until it you start the debugger, and the JVM discovers that the debugger has been started.
References
[1]Debug Java applications remotely with Eclipse
[2]POI/HSSF/XSSF from RPG


